Home › Forums › Weather & Weather Stations › RASP & Windgram Upgrades
- This topic has 24 replies, 8 voices, and was last updated 4 years, 3 months ago by
Justin Watts.
-
AuthorPosts
-
February 23, 2021 at 10:01 AM #11387
Alan Crouse
Premium MemberRetirement (and the weather) have provided the opportunity to spend some quality time with the Windgrams and the underlying RASP model. With a little help from the RASP community, a new version of both is nearing completion.
The improvements:
– Much newer version of the underlying wrf software; goes from wrf 2.1 to wrf 3.6.1;
– Docker-based (though still running locally at the moment);
– Revised input data, both newer and higher resolution (land-use, green-fraction, upper and lower soil type, and elevation data);
– Revised Windgram software.
The only loss from these upgrades will be the smaller, windowed models offered in the RASP viewer. As far as I can tell these are rarely (never?) used as the RASP model seems to be primarily accessed for XC planning.
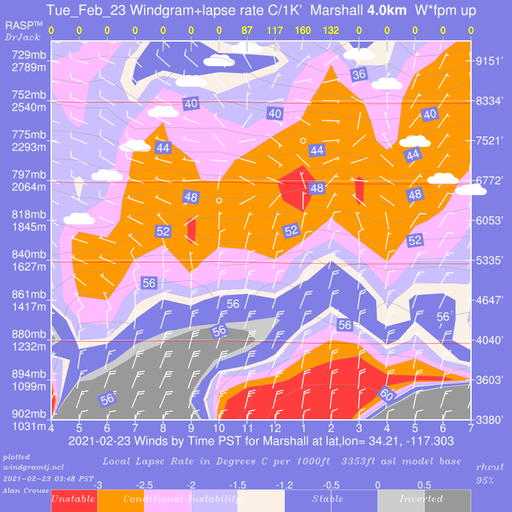
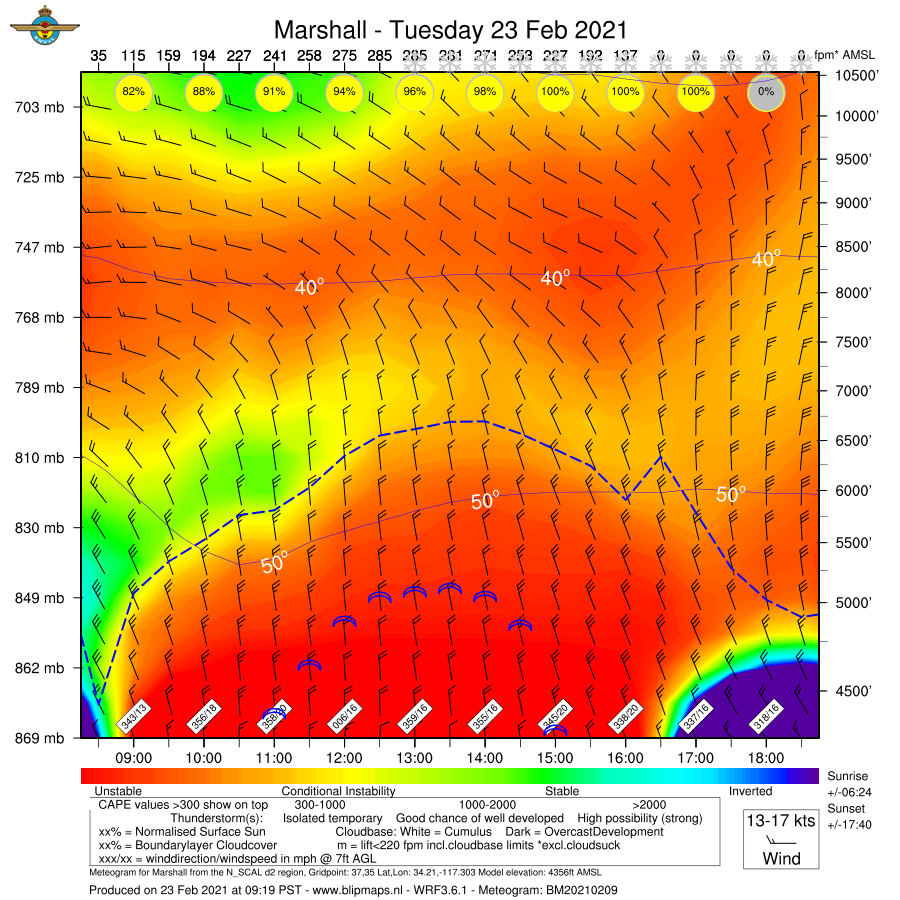
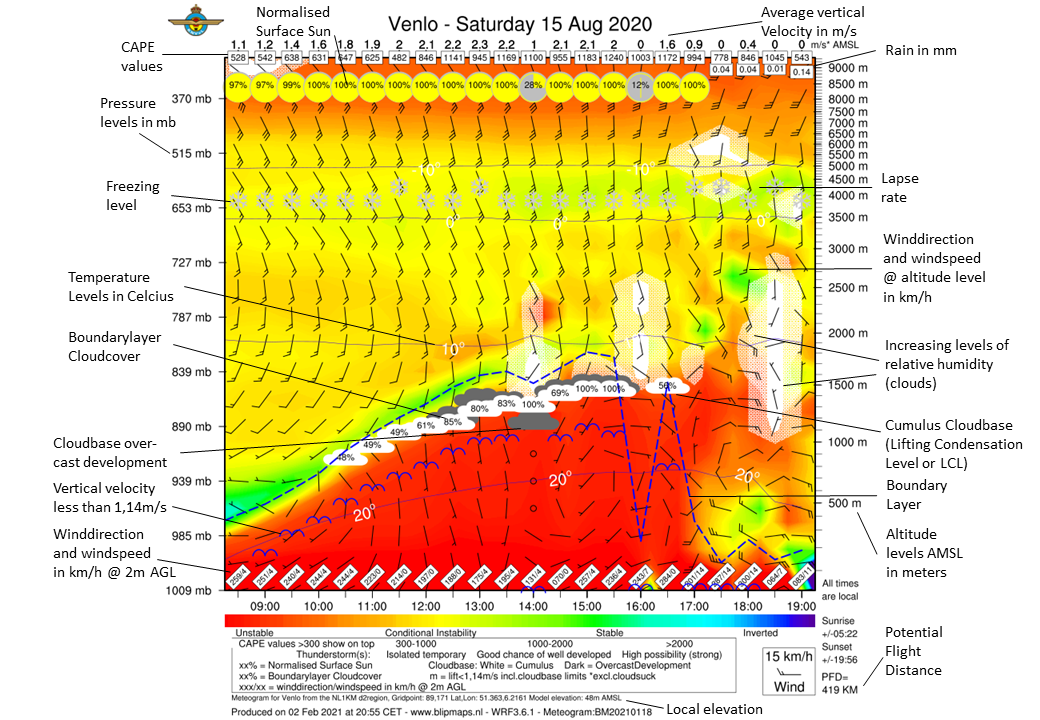
The Windgrams change quite a bit with this update. Here is an example from today’s Marshall diagram, along with an explanation (still showing the metric info). Nothing has been changed yet, so consider this an opportunity to comment.
Thank you,
Alan
 February 23, 2021 at 7:18 PM #11394
Thank you for working on this Alan !
If your windgrams go metric, the US will follow.
February 23, 2021 at 7:46 PM #11395Alan Crouse
Premium MemberJerome:
Relax, the explanation is still metric, but the Marshall sample shows data converted to units more familiar to our local pilots :-)
February 24, 2021 at 6:17 AM #11398 David Webb General Member
Metric by force! We need to enter the modern age and start counting by tens :D
February 24, 2021 at 8:20 AM #11399Alan Crouse
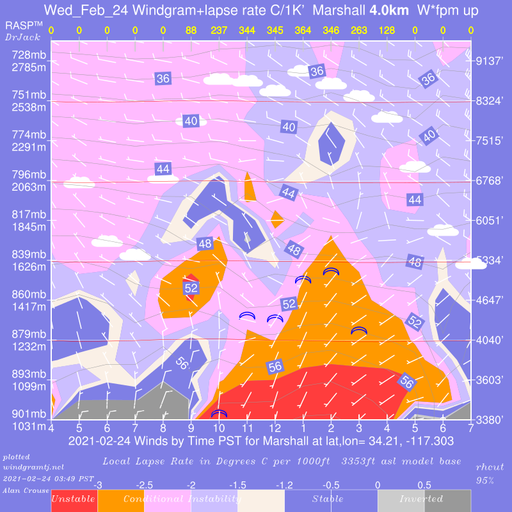
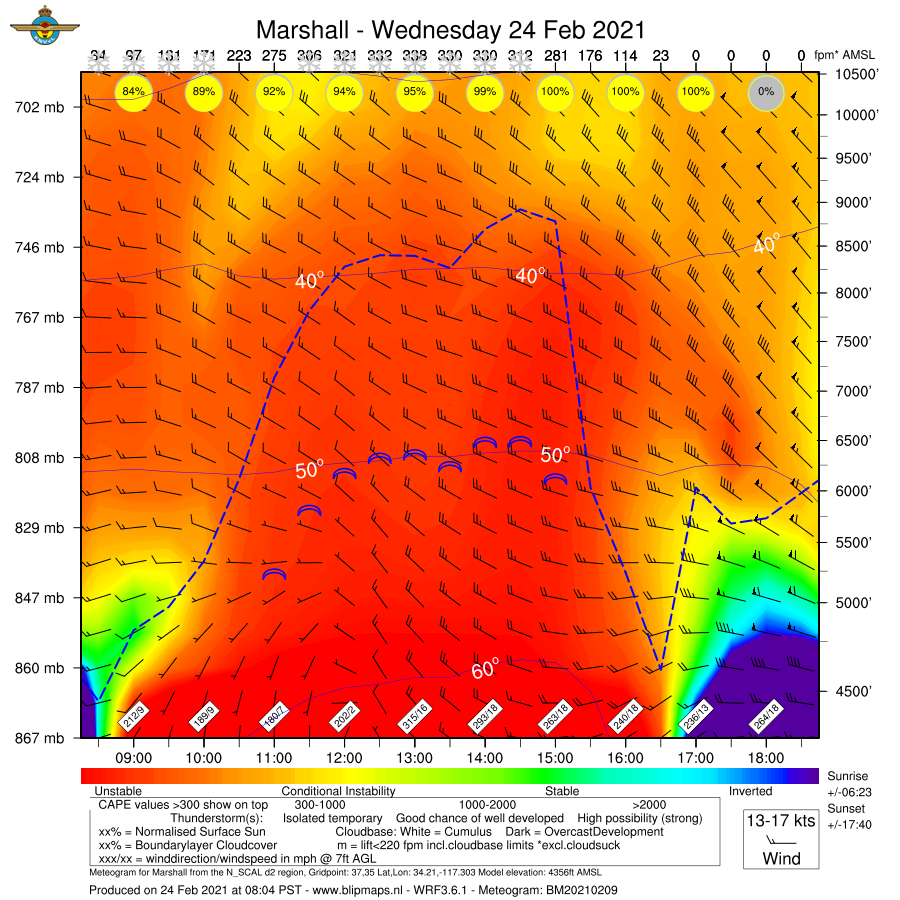
Premium MemberI ran today’s (2/24) as there is a truck running and it should be flyable. There are some differences in the forecast:
– New windgrams are more optimistic about the top of lift
– New windgrams are more pessimistic about the wind direction and forecast stronger winds later in the day.
 February 25, 2021 at 8:36 AM #11406
 David Webb General Member
Alan – looks like we have a very-scientific sample size of 3 over here, in addition to the Marshall weather station data from yesterday. Perhaps we can build up several of these comparisons to see which one holds up better for this location.
March 6, 2021 at 9:56 AM #11547Alan Crouse
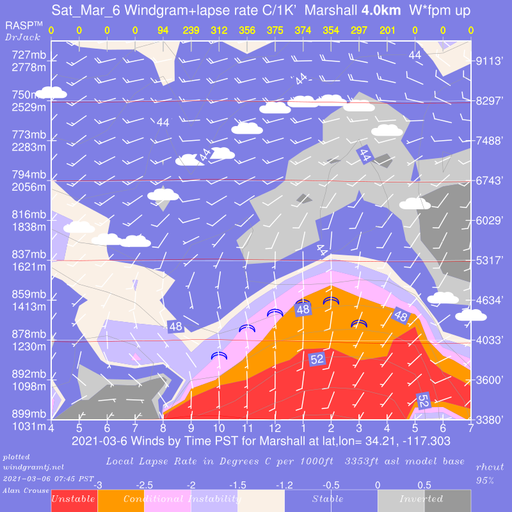
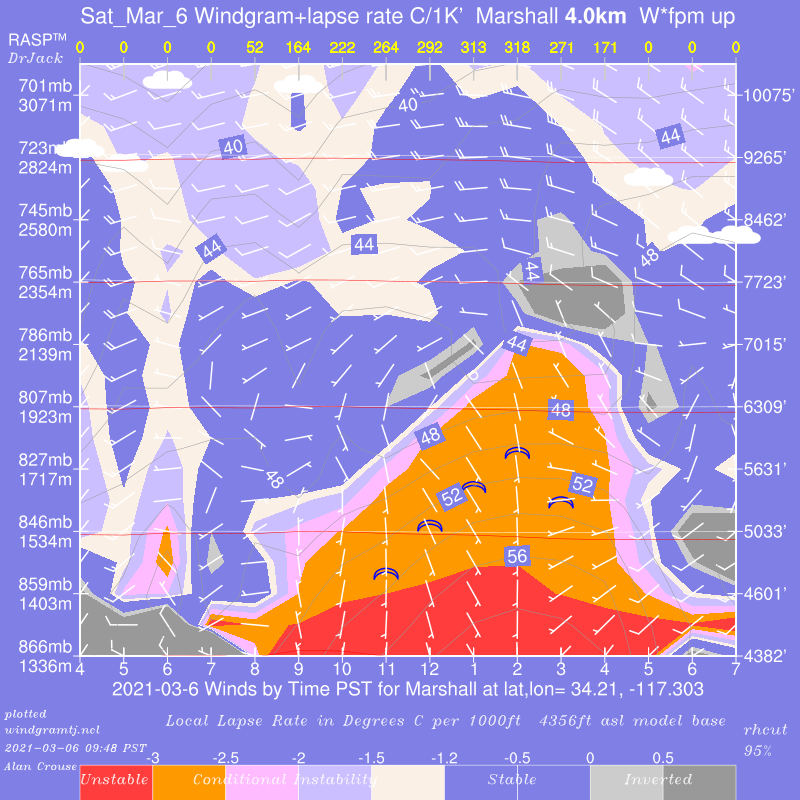
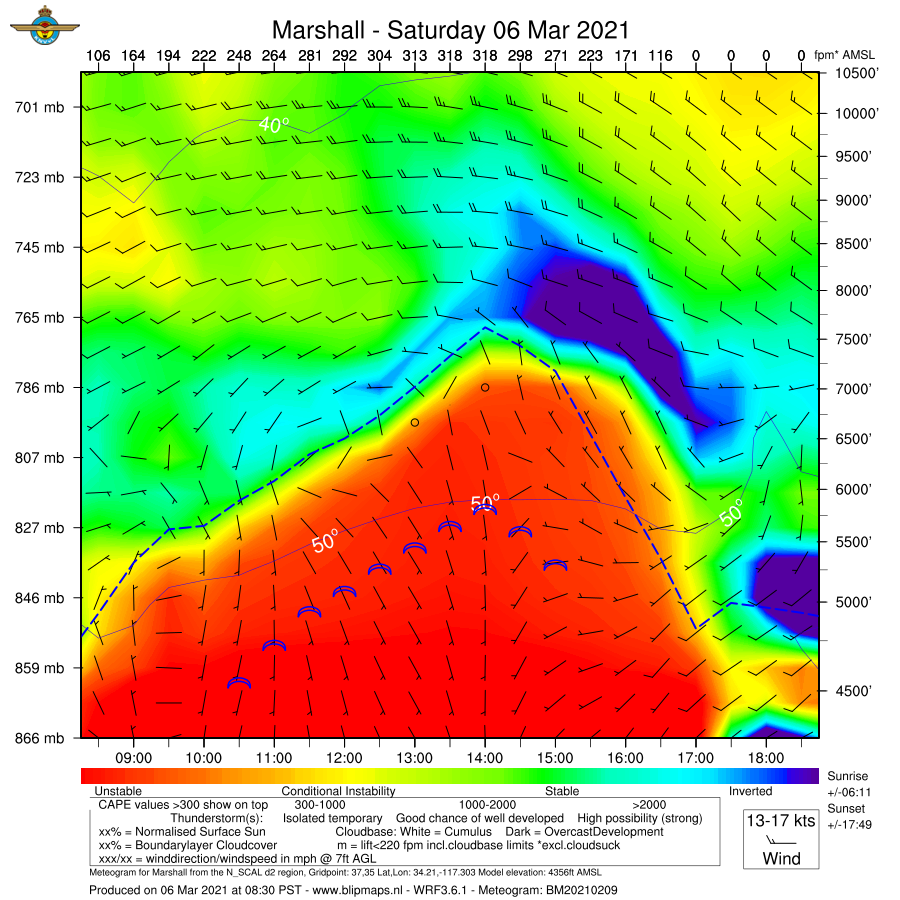
Premium MemberToday (3/6) for comparison we have:
– Old model data presented in old windgram format
– New model data presented in old windgram format
– New model data presented in new windgram (meteogram) format
All are from the same source data. I see only slight differences in the model predictions though the new model is (once again) more optimistic regarding altitudes…
Old Model, Old Format
New Model, Old Format
New model, new format
 March 6, 2021 at 11:24 AM #11548
 David Webb General Member
I’m a fan of the new model, old format (just my noob opinion).
I like that the new format shows more information, but kinda like the “lower fidelity” of the old – makes it super easy to see the differences as there are fewer colors to mentally process.
March 7, 2021 at 8:48 AM #11570Alan Crouse
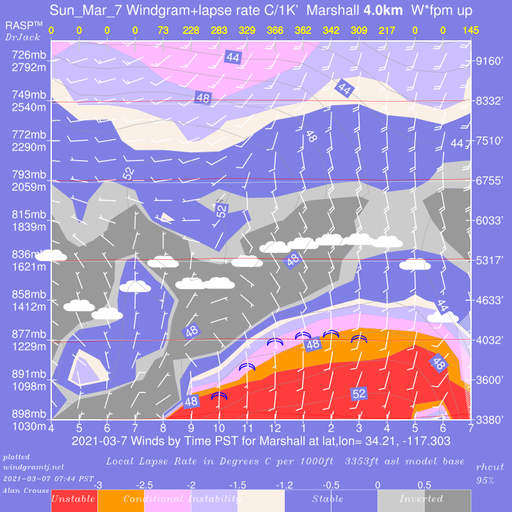
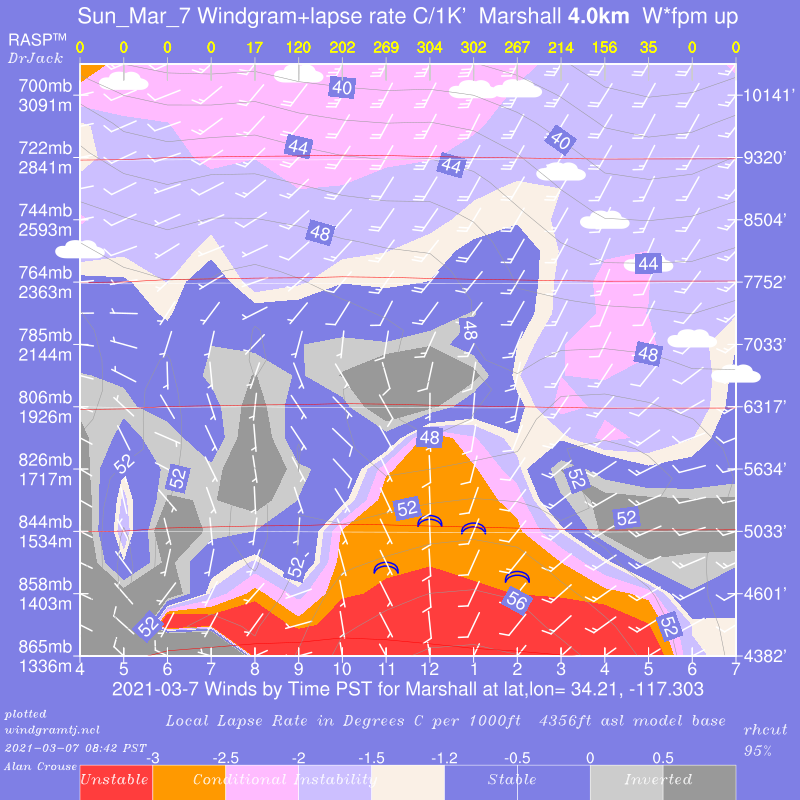
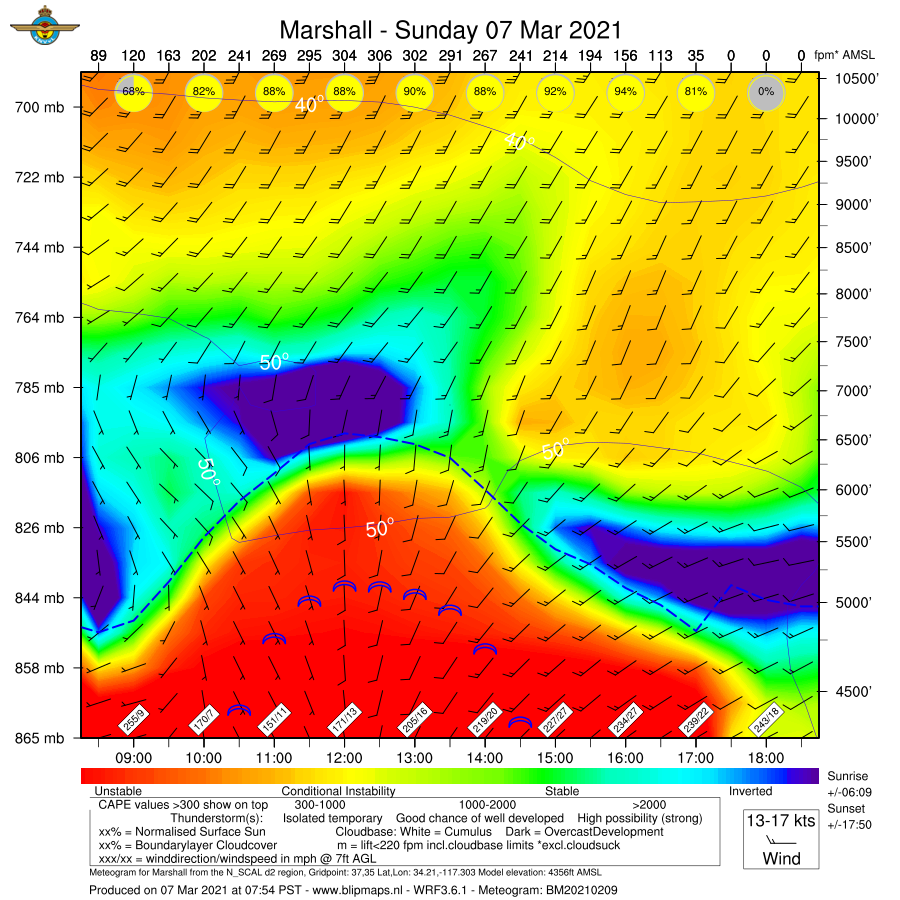
Premium MemberSame deal today (3/7):
– Old model, old format
– New model, old format
– New model, new format
I noticed there were some elements missing from yesterday’s new format version. Fixed that today. Same pattern as yesterday, not a lot of difference, but the new model predicts warmer temps and higher altitudes.
Old model, old format:
New model, old format:
New model, new format:
 March 8, 2021 at 5:18 PM #11596
Alan Crouse
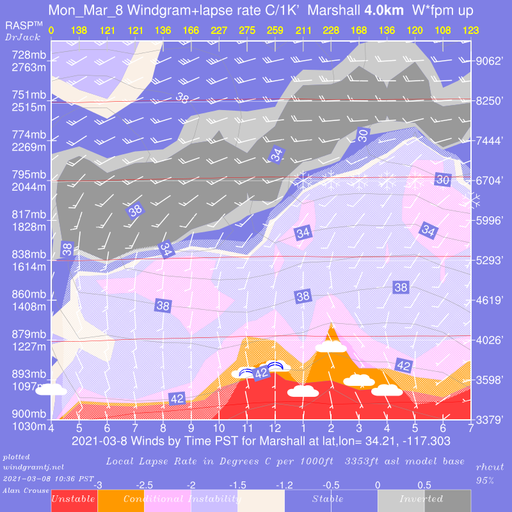
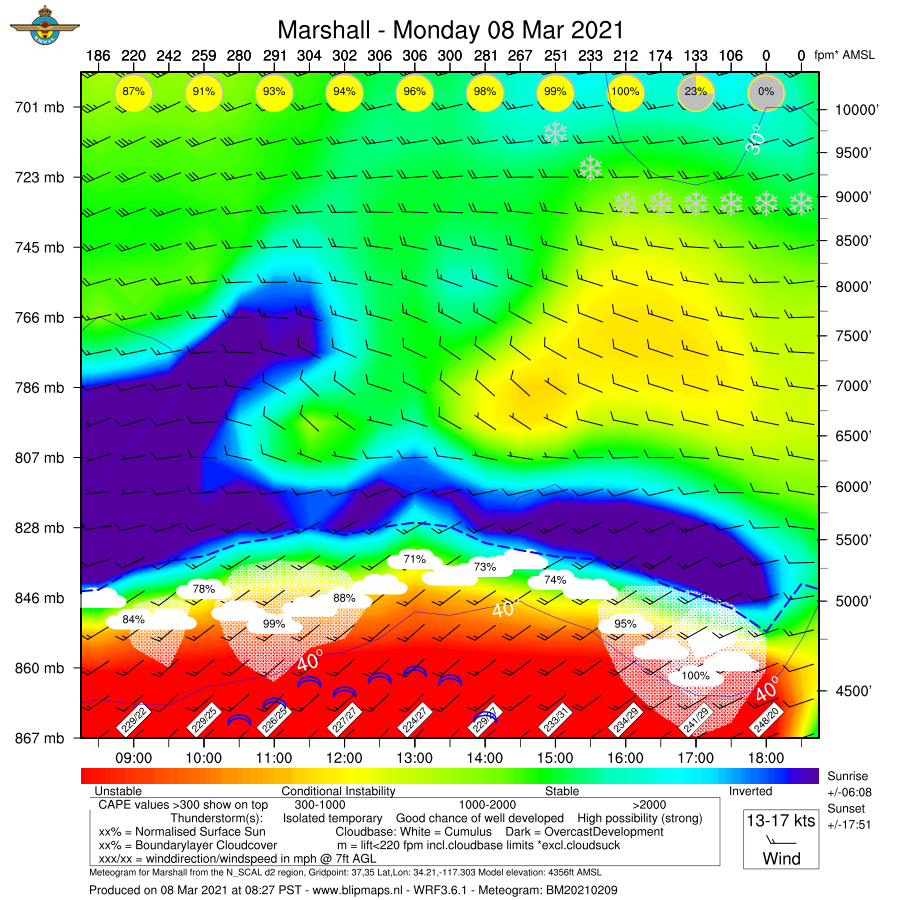
Premium MemberHere’s today (3/8) old model, old format and new model, new format. Mostly to show the new format’s handling of clouds and cloud cover %.
Old model, old format:
New model, new format:
 March 8, 2021 at 5:24 PM #11598
 David Webb General Member
The comparisons are great, Alan! Hope it’s not too much effort to keep ‘em coming – would be great to see if any trends emerge.
March 11, 2021 at 8:03 AM #11621Alan Crouse
Premium MemberI’ve modified the (not yet in full production) Docker image to produce both the old Windgram format and the new Meteogram format. I’m thinking I could add a button on the windgram web page to let folks choose. Running both models isn’t really a long term option, but I’m becoming increasingly comfortable with the new model results.
The new model is currently running the late day Entire area+1 model (shows up in the RASP viewer around 8 each evening for XC planning). Everything else you see is still the older product.
March 11, 2021 at 9:01 AM #11623 David Webb General Member
Thanks for your efforts on those, Alan.
March 18, 2021 at 2:14 PM #11703Alan Crouse
Premium MemberToday’s (and +1, +2 day’s) Windgrams and RASP data came from the new model. First complete unattended run was last night. Little more fiddling to do, including modifying the Windgram interface to make the Meteograms visible. Both Windgrams and Meteograms are generated now by the standard runs.
In other news, the Soaring Predictor charts have been running off weatherapi.com data for the past few weeks. Looks like NWS has shut down the XML data source that has driven the charts for over a decade. They have a new option, but it will take some significant coding to convert. Three day outlooks in the interim.
Any feedback on the addition of wind-gust to the site detail pages?
– Alan
March 18, 2021 at 6:09 PM #11704Thanks Alan for the tireless work you are doing.
I enjoy Windgrams and RASP, checking every day, flying or not.
After last changes Kagel forecasts have changed drastically,
altitudes start out around 5500 ft (Kagel is 3540).
Both Windgrams and RASP seem to suffer same issues.
At Sylmar Club we greatly appreciate your work,
More power to you!
-
AuthorPosts
- You must be logged in to reply to this topic.